hemanshiGetting Started with Plotly-PythonThe Plotly Python library is an interactive open-source library. This can be a very helpful tool for data visualization and understanding…8 min read·Jul 9, 2021----
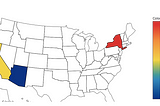
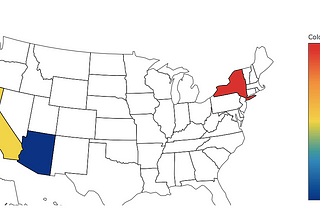
hemanshiPython | Geographical plotting using plotlyGeographical plotting is used for world map as well as states under a country. Mainly used by data analysts to check the agriculture…6 min read·Jul 9, 2021----
hemanshiDescriptive statisticsA large number of methods collectively compute descriptive statistics and other related operations on DataFrame. Most of these are…15 min read·Jul 9, 2021----
hemanshiAn introduction to seabornSeaborn is a library for making statistical graphics in Python. It builds on top of matplotlib and integrates closely with pandas data…17 min read·Jul 5, 2021----
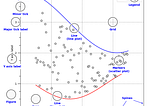
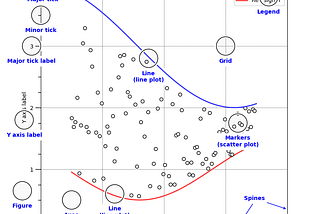
hemanshiINTRODUCTION TO MATPLOTLIBMatplotlib is one of the most popular Python packages used for data visualization.4 min read·Jul 4, 2021----
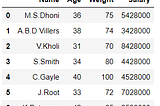
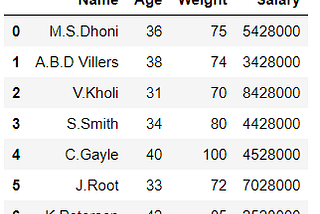
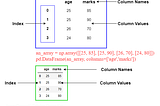
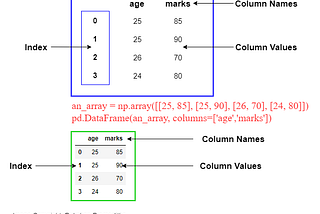
hemanshiData Structures in PandasPandas is an open-source library that uses for working with relational or labeled data both easily and intuitively. It provides various…28 min read·Jul 3, 2021----
hemanshiWhat is Pandas?Pandas is a Python library used for working with data sets.12 min read·Jul 2, 2021----
hemanshiNumPy Linear AlgebraNumpy provides the following functions to perform the different algebraic calculations on the input data.7 min read·Jun 30, 2021----
hemanshiWhat is NumPy?NumPy is a general-purpose array-processing package. It provides a high-performance multidimensional array object, and tools for working…9 min read·Jun 29, 2021----
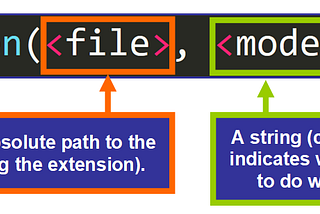
hemanshidata handling in pythonPython too supports file handling and allows users to handle files i.e., to read and write files, along with many other file handling…9 min read·Jun 26, 2021----